Multi-Resolution H3 Walkability Surfaces: A Scalable Framework for Cross-City Pedestrian Environment Assessment J. Williams, A. Al-Talabany
Proceedings of the 1st International Online Conference on Urban Sciences, 2026
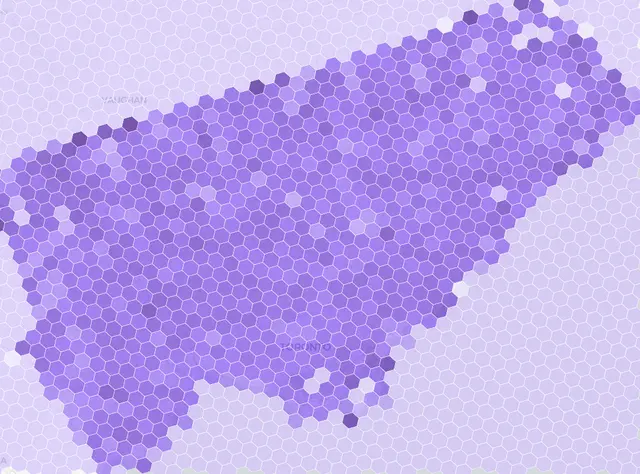
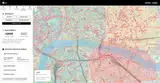
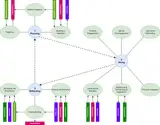
Introduction: Quantifying urban walkability at fine spatial resolution is essential for evidence-based active travel planning. Yet, existing indices typically rely on coarse administrative units or proprietary data, which impedes cross-city comparisons. This study presents the Hexagonal Walkability Surface (HWS) framework: a configuration-driven pipeline for computing multi-resolution walkability indices from geospatial data. Methods: HWS employs the H3 discrete global grid to tessellate city extents at four hierarchical resolutions (levels 8-11). Five pedestrian-environment features are extracted per hexagon: (1) footway and path density (pedestrian edge length per km²); (2) point-of-interest accessibility, combining in-cell counts with an inverse-distance-weighted proximity score; (3) land-use diversity as Shannon entropy of intersecting land-use classes; (4) greenspace proximity, integrating coverage proportion with distance decay; and (5) road-safety ratio of pedestrian-friendly to total edge length. Street network and land-use data are sourced from OpenStreetMap; place data is augmented with Overture Maps (2026-02-18) via DuckDB S3 queries. Features are min-max normalised and combined as a weighted composite score (0-100). Spatial autocorrelation (Getis-Ord Gi*) is used to identify clusters of walkability. Results: In Nottingham and Bristol, United Kingdom, the framework produces 1,178-57,700 and 2,581-126,518 hexagons per city, respectively, across resolutions 9-11. Across the resolutions, agreement is high (Spearman ρ = 0.963-0.971 between adjacent levels, all p < 0.001), confirming multi-scale consistency. At resolution 9 (roughly neighbourhood scale), intra-urban variation is observed in both cities (σ = 11.4 and 10.1 score points respectively), with city-centre hexagons clustering as hotspots and peripheral areas as coldspots. Gini coefficients indicate greater inequality in walkability in Nottingham (0.36) than in Bristol (0.26). Conclusions: HWS provides a reproducible, data-agnostic methodology extensible to any city with OSM coverage. The multi-resolution design could support both strategic (neighbourhood) and street-block planning decisions. By making fine-grained walkability assessment accessible to researchers and planners without proprietary data or bespoke infrastructure, HWS lowers the barrier to evidence-based active travel policy at the urban scale.


 22
22  20
20 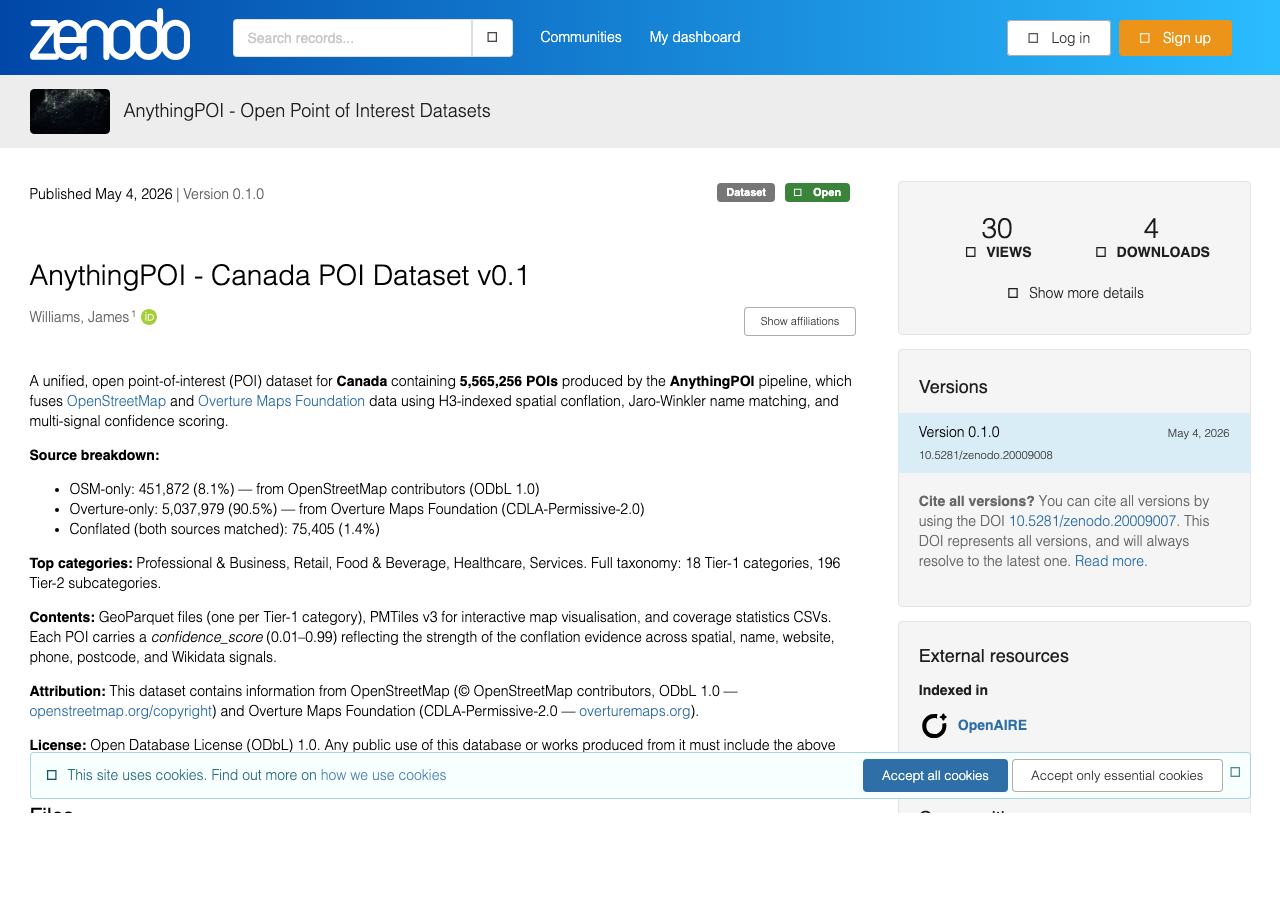 19
19  18
18