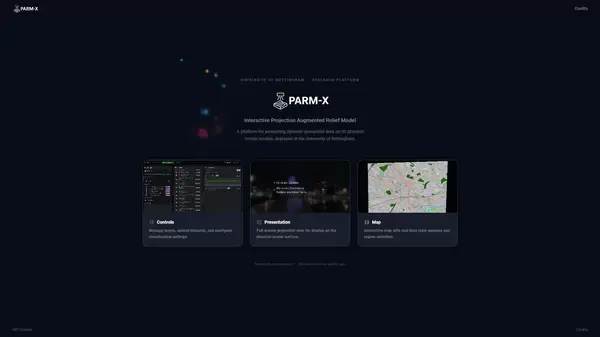
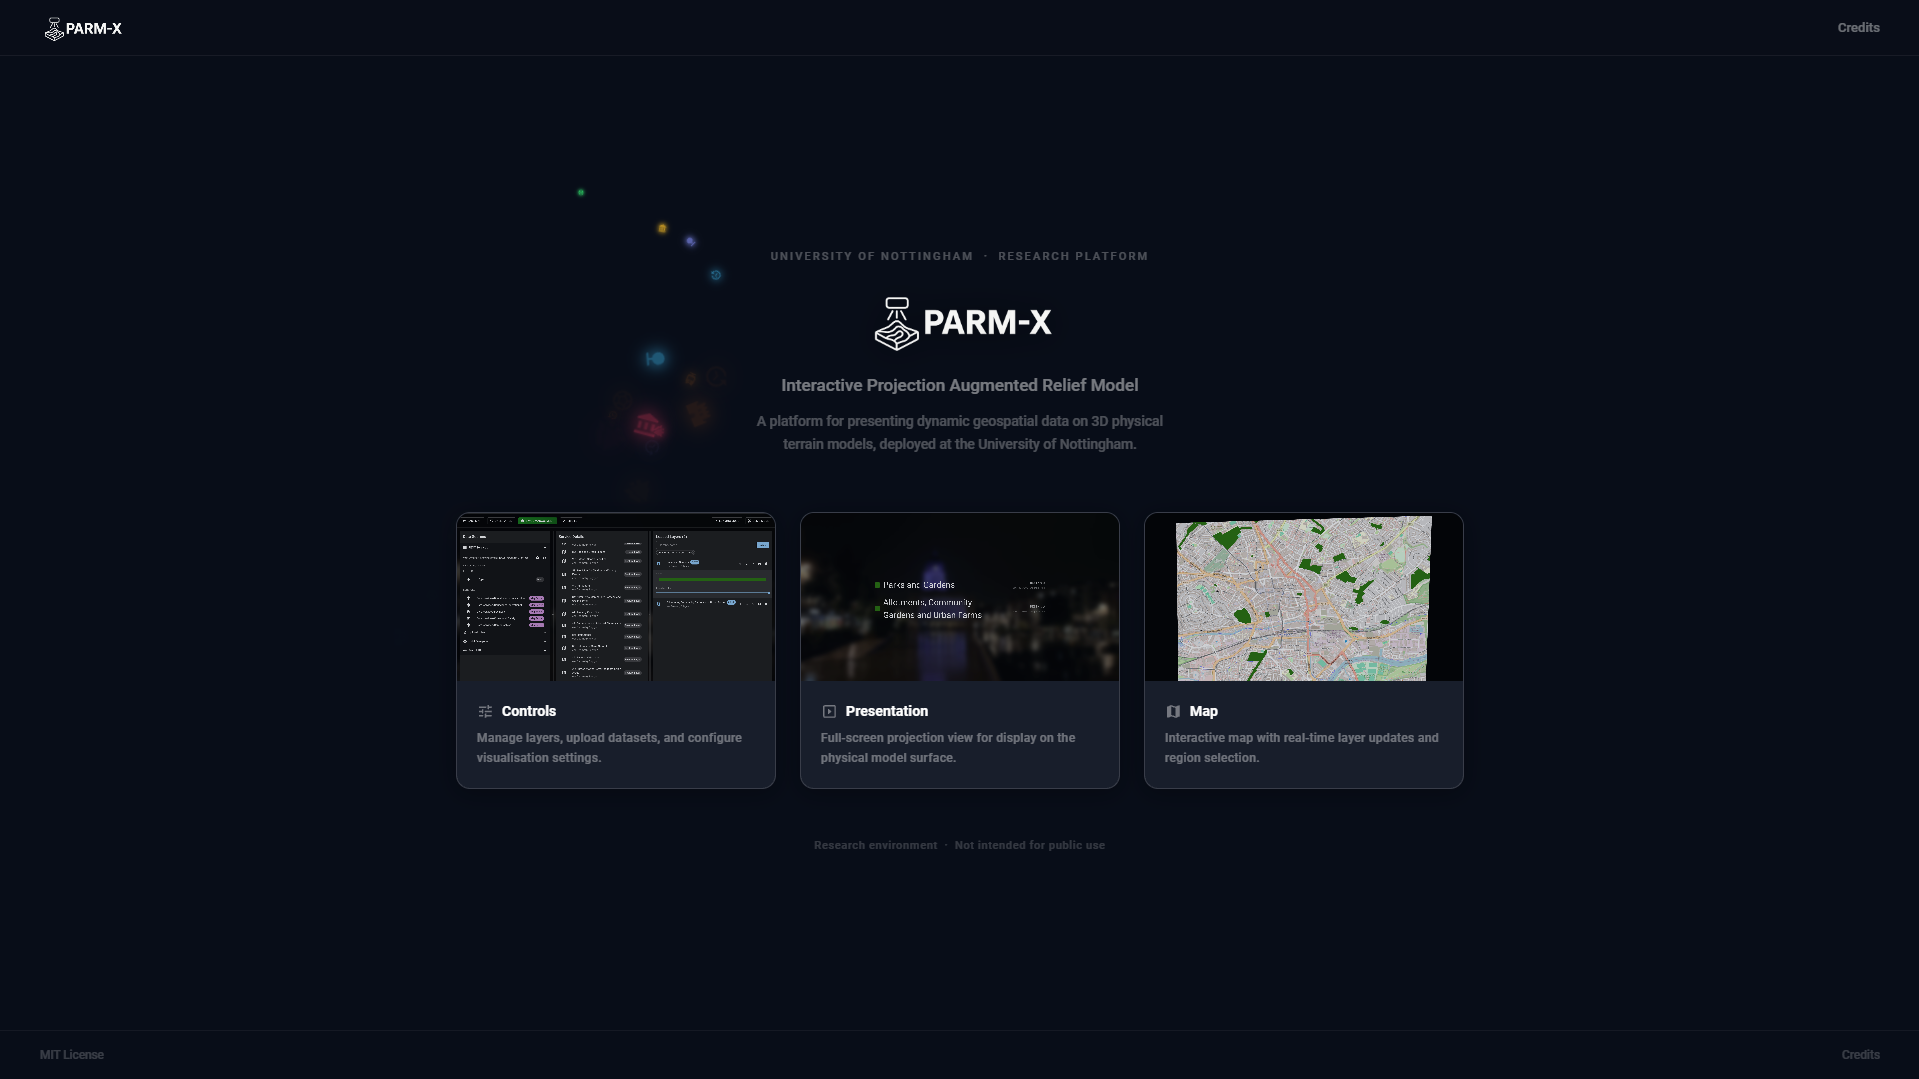
PARM-X is a research-grade web application developed to support interactive, real-time data presentation on physical relief models — currently configured for Nottingham, UK. It enables researchers and public engagement facilitators to load, style, and project geographic data layers onto a physical terrain model, while simultaneously collecting structured input from participants through drawing, polling, and text response interfaces accessible via QR code on personal devices.
The system is built around a three-screen architecture: an operator-facing Controls interface, a Map Display projected onto the physical model, and a read-only Presentation screen for public audiences. All three windows remain in synchronisation through the browser’s BroadcastChannel API — no server-side relay required. A fourth route (/draw) provides a mobile-optimised participant interface for structured data collection.
Three-Screen Architecture
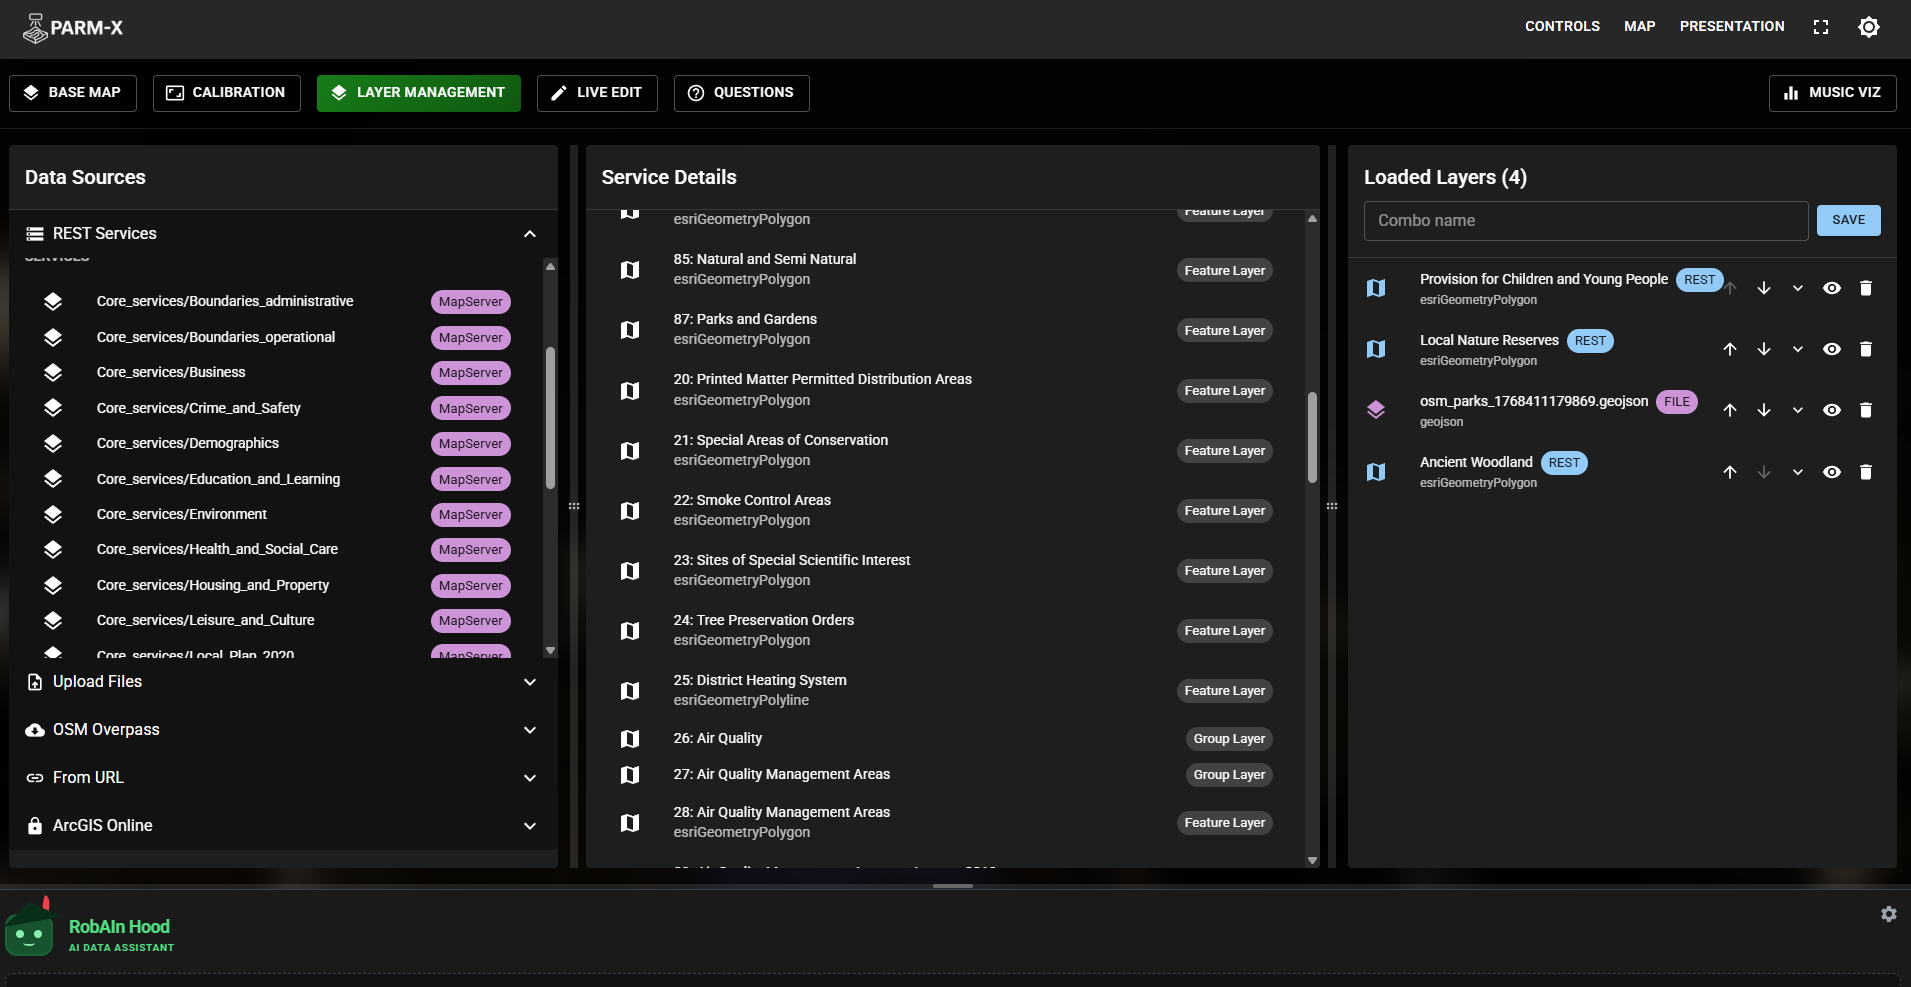
The application runs as three independent browser windows served from the same origin. A single Zustand store serialises all application state and broadcasts changes via named BroadcastChannel instances, ensuring that a layer toggled in the Controls window appears on the projected Map Display within milliseconds. Separate channels handle video/image overlays (parm-video), music sync (music_sync_channel), game events (parm-games), screenshot requests (parm-screenshot), and agent simulation data.
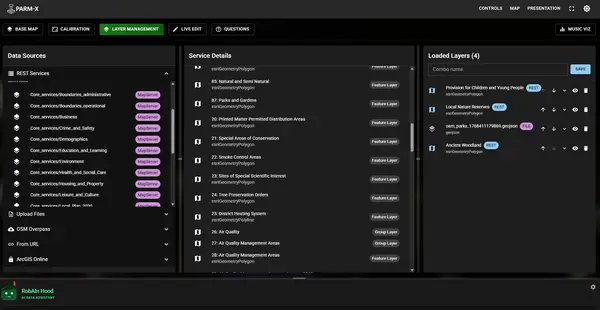
Controls (/controls) is the operator’s command interface, structured into four tab panels: Map (base map, style, display), Layers (data sources), Live (drawing tools), and Fun (music, media, agents, games, AI, Q&A). A persistent top navigation bar provides one-click access to the Map and Presentation windows.
Map Display (/map) is a fullscreen Leaflet map locked to precise geographic bounds derived from a shapefile header. CSS transform properties — scale, offset, skew, rotation — are applied to a map-viewport element so the rendered tiles align with the physical dimensions of the relief model. The map also receives and renders video/image overlays, weather effects, agent simulations, and game state, all broadcast from Controls.
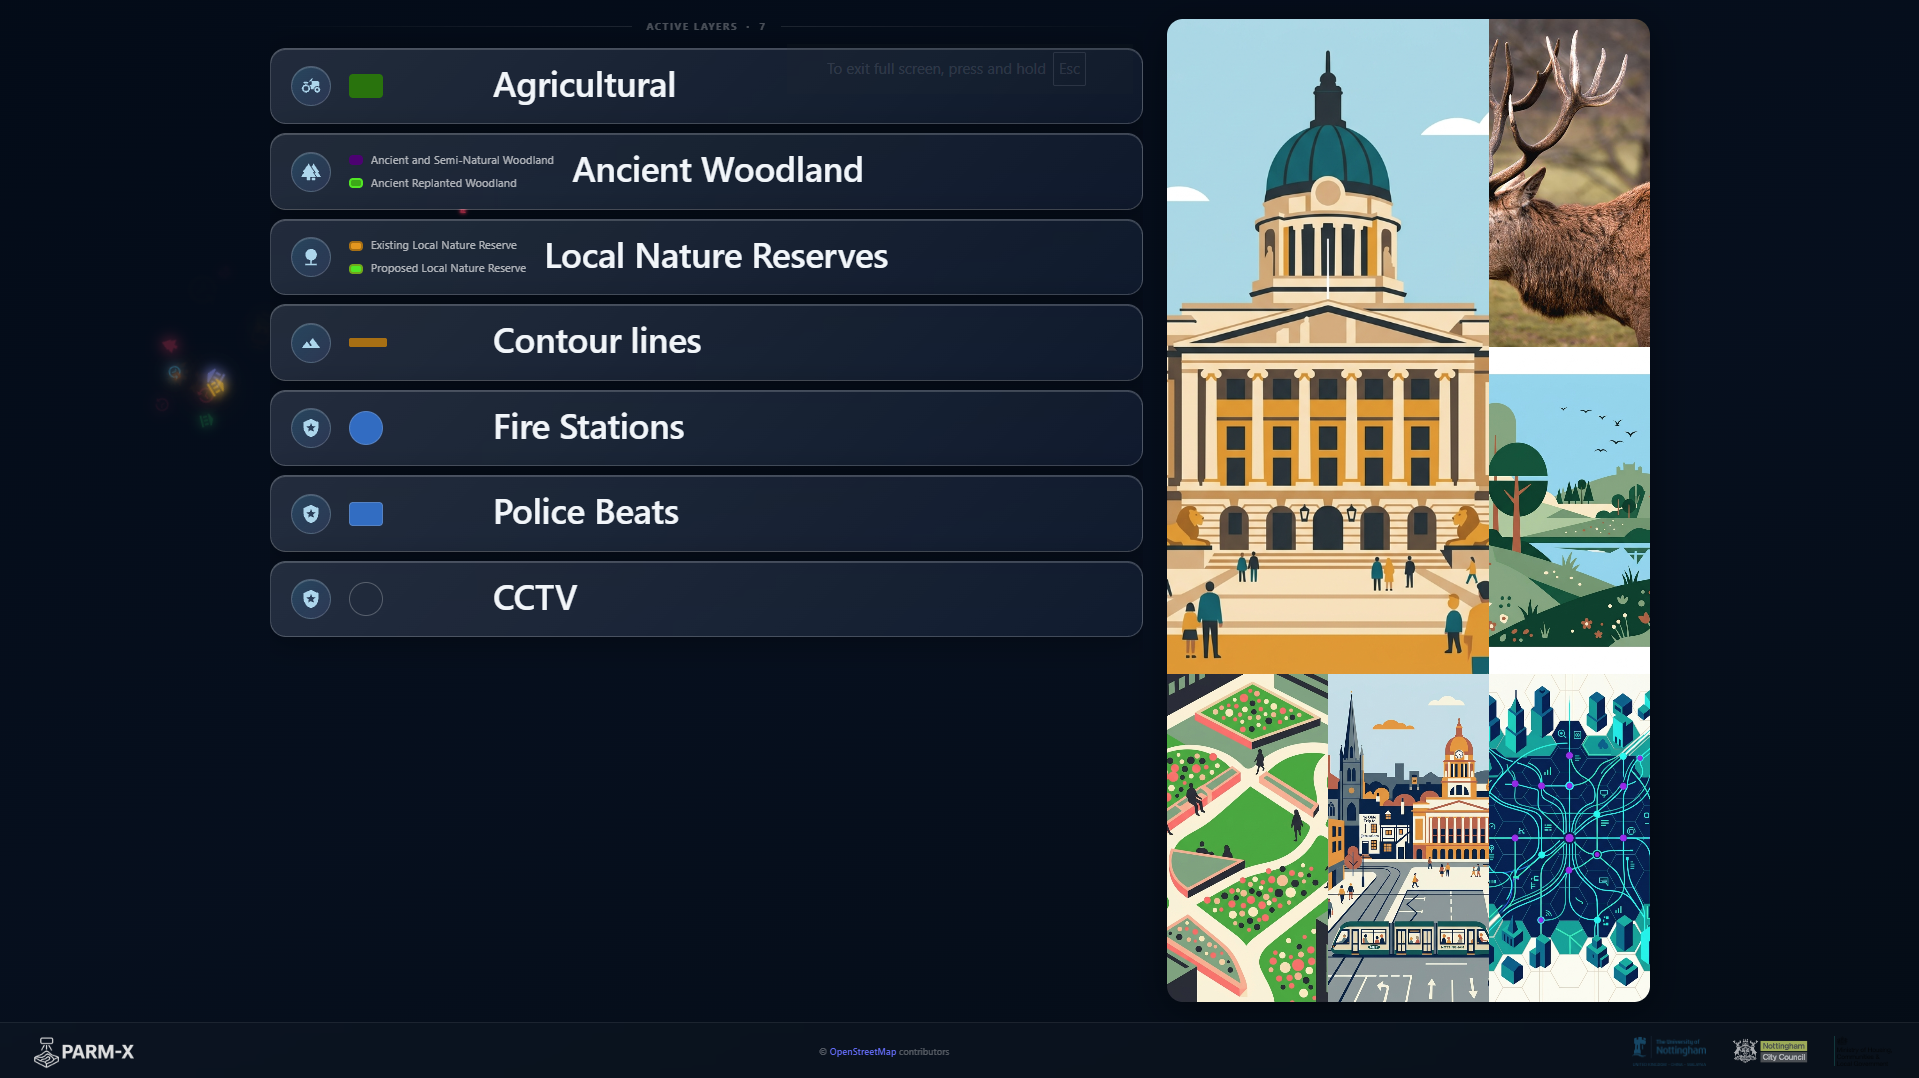
Presentation (/presentation) renders a clean read-out of all visible layers with source type (BUILT-IN / FILE / REST), styling summary, and — when a research project is active — a QR code linking participants to the drawing interface. This screen is designed for projection to a public audience and updates automatically as layers are toggled.
Draw (/draw?project=<id>) is a mobile-first participant interface that renders a locked Leaflet map with pen and spray drawing tools, alongside poll, text, and slider response types. It communicates exclusively with the Supabase backend; all contributions flow into the database and trigger real-time updates on the Map and Presentation screens.
Data Sources
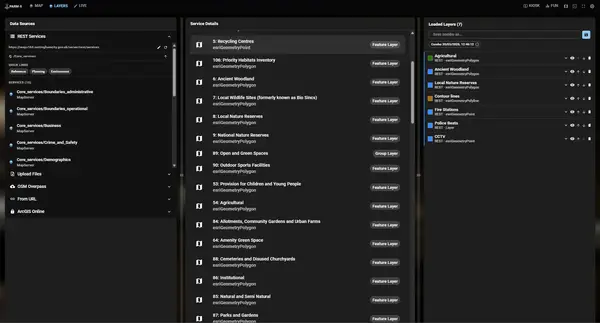
PARM-X integrates five data pipelines simultaneously:
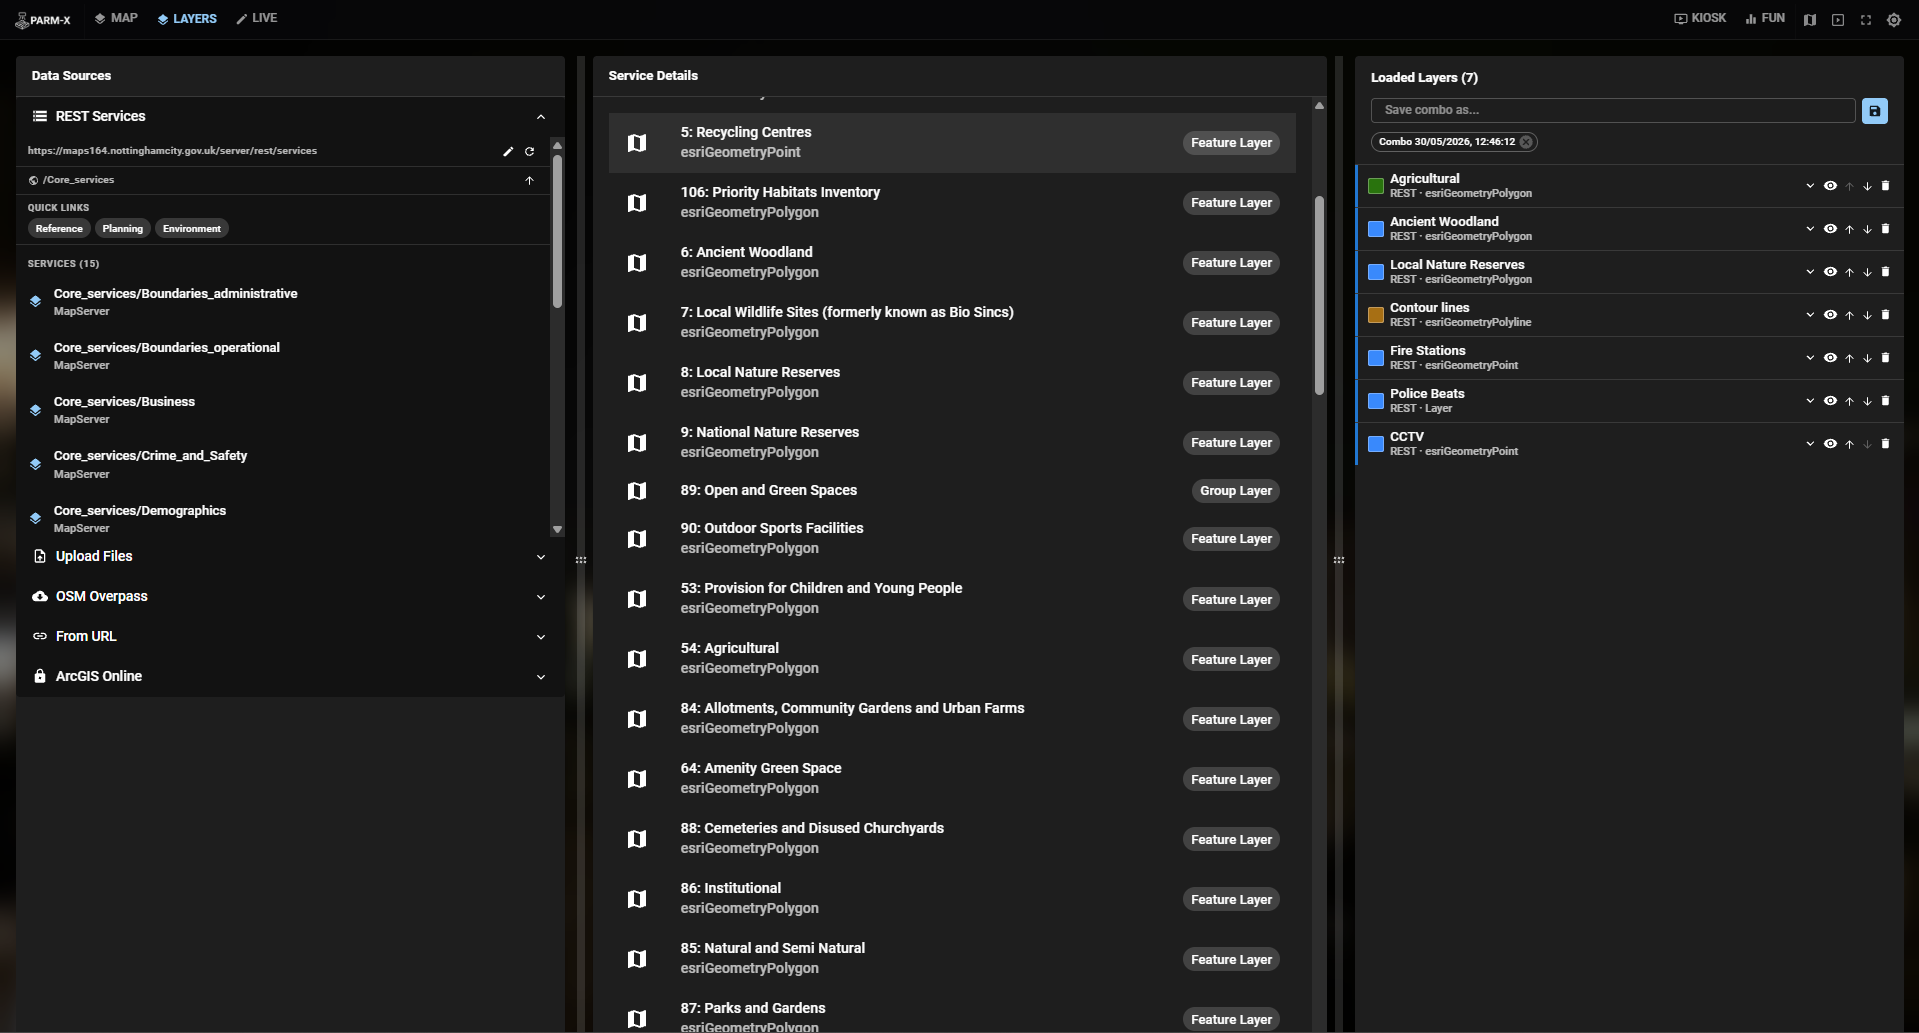
ArcGIS REST Services — The default root is Nottingham City Council’s ArcGIS REST endpoint. The layer browser navigates the folder tree, retrieves service metadata, and renders layers either as dynamic map images (via Esri-Leaflet’s dynamicMapLayer) or as downloaded GeoJSON depending on layer type and user preference. Styling is parsed directly from the service’s drawingInfo renderer object and mapped to Leaflet path options. Recent datasets are cached for quick reload.
File Uploads — GeoJSON, CSV (with automatic lat/lon column detection), and Shapefiles (including zipped multi-file bundles) are parsed client-side. Shapefiles are processed by shpjs. CSVs are parsed with a bespoke function that handles quoted fields and common column name variants (lat/latitude/y/northing, etc.).
OSM Overpass API — Arbitrary Overpass QL queries (e.g. amenity=restaurant, building=university) are executed and results ingested as GeoJSON point layers directly onto the map.
URL / WMS — Direct GeoJSON URLs and OGC WMS tile endpoints can be loaded by pasting a URL into the interface.
ArcGIS Online (authenticated) — A Vercel serverless function handles token generation and proxied data download from ArcGIS Online portals, allowing access to protected Feature Services and Web Maps without exposing credentials client-side.
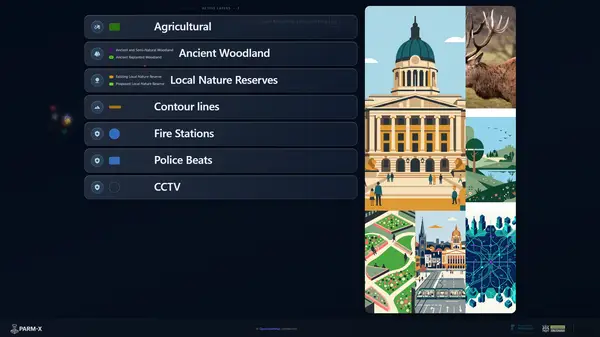
All loaded layers are tracked in a unified list with per-layer visibility, z-index, opacity, custom colour, and filter controls. Derived layers — heatmap (Leaflet.heat), Voronoi tessellation, H3 hexagonal grid (H3-js), regular hexgrid (Turf.js), and cluster — can be computed on-the-fly from any point dataset.
Projection Calibration
Aligning a digital map to a physical model is a non-trivial geometric problem. PARM-X implements a homography-based calibration workflow: the operator clicks the four corners of the physical model surface on the Map Display screen; the system computes a CSS matrix3d perspective transform using a bespoke Gaussian elimination solver and applies it to the map-viewport element. The map is then re-fitted to the exact geographic bounds so that tiles, vector overlays, and drawn shapes land in the correct physical position regardless of projector angle or perspective distortion.
Calibration state persists in the Zustand store for the session. On reset, the viewport is restored to full-screen bounds.
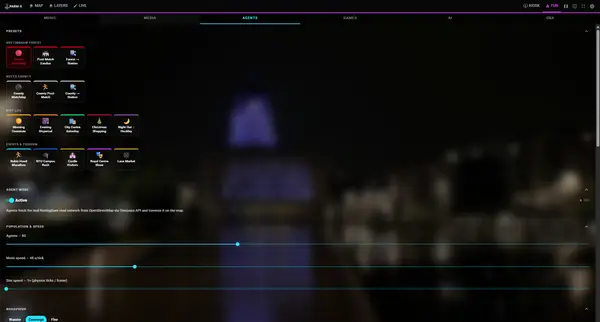
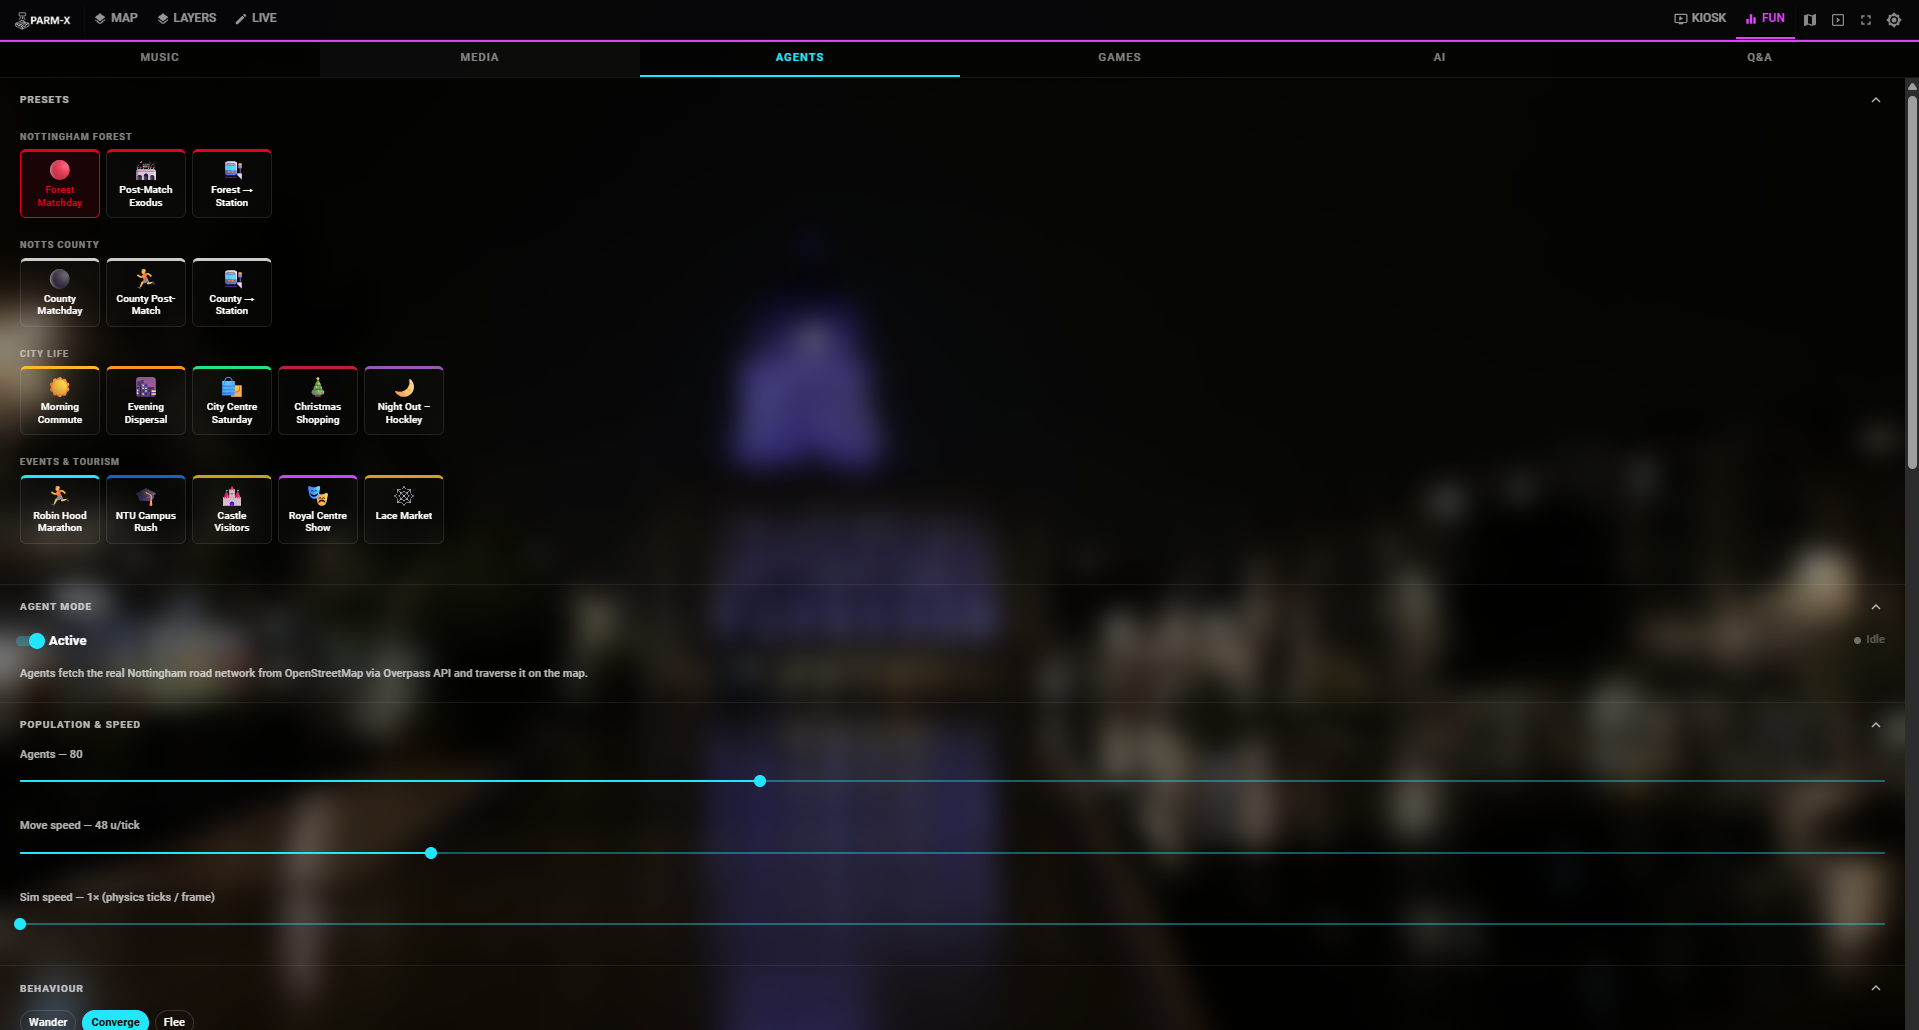
Agent Simulation
PARM-X includes a pedestrian agent simulation engine. Agents navigate Nottingham’s road network — loaded in real time from the OpenStreetMap Overpass API — using a configurable set of origin and destination places drawn from landmarks, transport hubs, stadiums, and neighbourhoods. Multiple simulation presets model real-world scenarios:
- Matchday scenarios for Nottingham Forest and Notts County (pre-match arrival, post-match dispersal, stadium-to-station flows)
- Daily commute patterns (morning peak, evening dispersal)
- Event flows (Robin Hood Marathon, university rush hour, Christmas shopping, Hockley night economy)
- Tourism circuits (castle visitors, Lace Market wander, Royal Centre audiences)
Road network loading is status-tracked (idle → loading → ready / error) with a live road count display. Agents are rendered as sprite-based markers with configurable road type filters — operators can restrict movement to specific highway categories (trunk, primary, residential, footway, cycleway, etc.) to model different population behaviours on the same network.
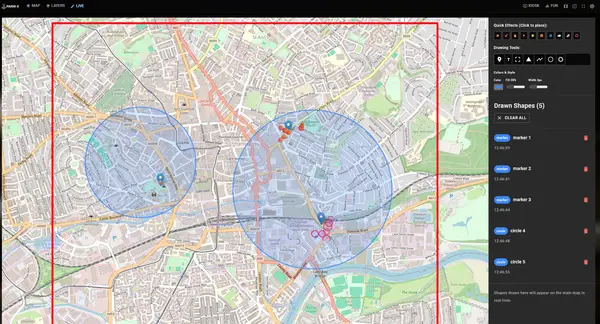
Live Drawing Tools
The live drawing panel renders a secondary Leaflet map bounded to the Nottingham model extent. Operators can place markers, draw polylines, polygons, circles, and rectangles, and add floating text labels. Each shape is stored as a GeoJSON Feature in the Zustand store and replicated to the Map Display via BroadcastChannel.
Shapes support visual effects — sparkle, pulse, glow, fire, snow, electric, bounce, rainbow, heart — applied as CSS animation classes to Leaflet SVG elements at runtime. A separate floating overlays system allows point-click placement of particle effect emitters (hearts, clouds, sparks, electric bursts) directly onto the projected map surface.

Research Projects & Participatory Data Collection
PARM-X includes a structured data collection system backed by Supabase. Authenticated administrators create Projects with one of four interaction types:
- Drawing — participants draw on a locked map using pen stroke or spray tool; each visitor receives a randomly assigned session colour
- Poll — multiple-choice vote; results aggregate in real time and can be overlaid on the map
- Text Response — free-text answer stored to the database
- Slider — continuous scale response with configurable min/max/step and labelled endpoints
Projects can be grouped and sequenced, forming a multi-step survey wizard: participants scan a single QR code and step through each question in turn, advancing automatically after each non-drawing response. Spray drawing uses an upsert aggregation strategy — successive contributions from the same user are appended to a single database record rather than inserted as separate rows, reducing write volume while preserving spatial fidelity.
Contributions are stored as PostGIS-compatible payloads in a PostgreSQL schema protected by Row Level Security policies. All connected screens receive live updates through Supabase Realtime subscriptions. Collected data can be exported as JSON for analysis in external GIS or statistical tools.
Games
The Fun panel exposes three map-based games broadcast to the Map Display:
- Find Robin — a timed hide-and-seek game where a hidden Robin Hood marker is revealed after a 30-second countdown, encouraging audience engagement during quiet periods
- Pixel Map — a pixelated map identification challenge
- Memory Map — a spatial memory recall game
Game events are coordinated via a dedicated parm-games BroadcastChannel, keeping game state entirely separate from the mapping and layer pipelines.
Weather Overlay
A live weather integration fetches current conditions for Nottingham from the Open-Meteo API and interprets WMO weather codes into three visual modes: clear, rain, and snow. The corresponding weather animation is applied as a canvas or CSS overlay on the Map Display, providing contextual atmospheric effects for presentations. The overlay activates on demand from the Controls interface and updates automatically once triggered.
Media Overlays
The Media sub-panel allows operators to project still images or video footage directly onto the map surface as full-screen overlays with adjustable opacity. A curated library of Nottingham footage and aerial/ground-level imagery is bundled with the application. Individual clips can be selected and played, or the entire video library can be set to loop all mode for ambient background use. Switching to a media overlay automatically sets the base map to satellite imagery to provide geographic grounding beneath the footage.
Map Style Controls
Beyond base map selection (OpenStreetMap, CartoDB Dark/Light, Esri Satellite, OpenTopoMap), PARM-X provides a CSS filter preset system applied to the entire map tile layer. Named presets include: Robin Hood (warm sepia), Blueprint (inverted blue), Nightlife (high-contrast invert), Grayscale, Vibrant (saturated), Retro, and Faded. Operators can also enter arbitrary CSS filter strings for fully custom visual treatment, allowing instant visual re-theming of the projected map to match presentation context without changing any underlying data.
Music Visualiser
A dedicated MusicSyncService manages a persistent music_sync_channel BroadcastChannel singleton, decoupled from the main Zustand store. It handles PLAY, PAUSE, STOP, SET_SENSITIVITY, and SET_VISUALIZER_ACTIVE commands, as well as binary audio file transfers between windows. The Map Display subscribes to both command and data streams; late-mounting components receive the last-seen audio file immediately on subscription to prevent missed state. Audio frequency data (bass, mid, treble via Web Audio API) drives visual parameters — layer pulse intensity, glow radius, overlay opacity — so all screens react to the same beat simultaneously.
AI Chat Assistant
An embedded conversational assistant (RobAIn) built into the Controls screen with typed and voice input via the Web Speech Recognition API. Designed to answer contextual questions about the active map state and Nottingham-specific datasets, and to help operators navigate the interface without leaving the main view.
Screenshot Export
A one-click Export Map as PNG function sends a SCREENSHOT_REQUEST message via a dedicated parm-screenshot BroadcastChannel. The Map Display captures the current canvas state — including all active layers, overlays, and effects — and triggers a client-side file download, allowing operators to document the projected state without switching windows or using external capture tools.
Kiosk Mode
A dedicated Kiosk Mode transforms the Controls interface into a simplified display-facing view, hiding operator panels and presenting a clean full-screen state suitable for unmanned public kiosk installations.
Research Significance
Physical relief models are a well-established medium for public engagement in urban planning, emergency management, and geographic education. Their tactile, three-dimensional character invites interaction in ways that flat screens do not — particularly with non-specialist audiences. The limiting factor has historically been information rigidity: a physical model is static.
PARM-X removes that constraint. By precisely aligning a live digital map onto the model surface, it becomes possible to drape any open or proprietary dataset — infrastructure networks, flood risk extents, demographic data, real-time sensor feeds, historical imagery — over the physical terrain and switch between them interactively during a session. The calibration system handles off-axis and perspective projections, so the projector does not need to be mounted directly overhead.
The agent simulation extends this further by enabling dynamic scenario modelling on the physical surface: audiences can observe simulated crowd flows for a Forest matchday, a city-centre Saturday, or a marathon route, grounding abstract mobility data in the physical landscape they recognise. The participatory layer bridges passive observation and active data collection — visitors mark locations of perceived risk, vote on planning proposals, or complete a multi-step spatial survey, with responses appearing immediately on the shared projected surface.
The platform is built entirely on open-source components and open data standards (GeoJSON, Shapefile, OGC WMS, ArcGIS REST, OSM Overpass) and can be reconfigured for any city or geographic extent by updating the bounds constants and default ArcGIS endpoint.