Mapping the “Unmappable”
Traditional maps are excellent at telling us where something is, but they struggle to explain how it feels to be there. A GPS trace can show a runner’s speed or elevation, but it captures nothing of the “sense of place”—the feeling of safety, the beauty of a view, or the noise of traffic.
WalkGIS is a mixed-methods research tool designed to bridge this gap. It captures the “human layer” of geography by fusing hard spatial data (GPS coordinates) with rich, qualitative lived experiences (first-person video and think-aloud audio narratives).
WalkGIS enables researchers to move beyond simple “tracks on a map” to analyze the complex, subjective relationship between people and the places they move through.
The “Linked Narrative” Engine
The core innovation of WalkGIS is the tight synchronization between media formats. In a standard workflow, a researcher might have a video file in one window and a map in another—completely disconnected.
WalkGIS creates a unified Spatial Video Narrative environment:
- Bi-Directional Scrubbing: Drag the video timeline, and the map marker moves instantly to that location. Click a point on the map, and the video jumps to that exact moment in the walk.
- Integrated Transcription: As participants “think aloud” while walking, their words are transcribed and time-stamped directly into the system, allowing text to be queried spatially (e.g., “Show me everywhere the participant mentioned ‘traffic’”).
- Visual Analytics: Multiple coordinated views allow researchers to see the video, map, transcript, and data visualizations simultaneously.
Handling “Fuzzy” Data
Human experiences don’t have sharp edges. We don’t say “I felt safe exactly at coordinate X/Y”; we say “this whole area feels friendly.”
To handle this ambiguity, WalkGIS introduces “Platial” Visualization Tools:
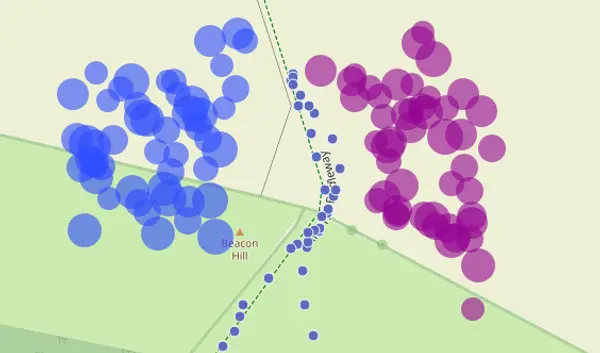
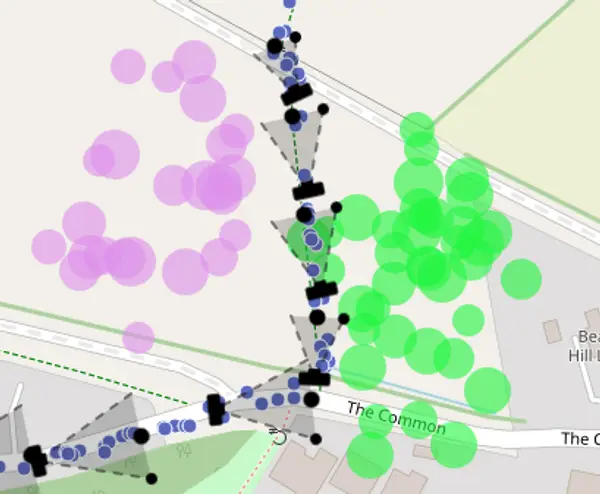
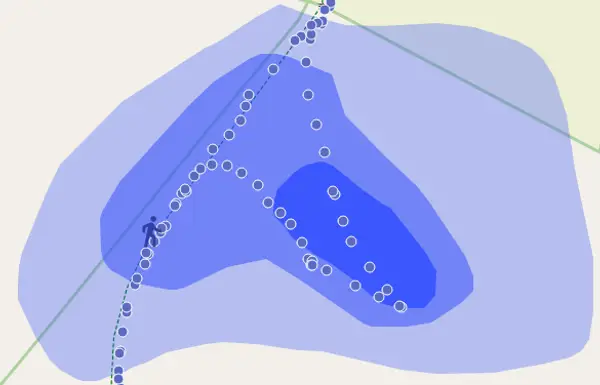
- The Spraycan: Borrowing from graffiti art, this tool allows researchers to “spray” attributes onto the map. This creates fuzzy, vague boundaries that better represent human perception than rigid polygons.
- Gradient Contours: Multilevel transparency tools help visualize user-defined boundaries of “place” (e.g., where “The City Centre” begins and ends for a specific person), embracing the uncertainty inherent in qualitative data.
Technical Implementation
Unlike heavy desktop GIS software, WalkGIS is built as a lightweight, standalone web application using:
- Leaflet & Turf.js: For all client-side mapping and spatial analysis (calculating distances, buffers, and intersections directly in the browser).
- HTML5 Media APIs: To handle frame-accurate video synchronization without external plugins.
- Local-First Architecture: It processes local GeoJSON and video files, ensuring privacy for study participants by keeping sensitive video data off the cloud.
Research Impact
This tool was developed to support a broader investigation into Platial Analysis—understanding the world as a set of meaningful “places” rather than just “spaces.” It has enabled new insights into leisure walking behaviors, helping urban planners understand not just where people walk, but why they choose those routes and how they experience them.
Presented at GISRUK 2023: “WalkGIS: Exploring Platial Analysis of Leisure Walks via Linked Video Narratives”