Contemporary urban analysis requires tools that can capture not only the physical structure of cities, but also the dynamic, human-centred places that emerge from everyday interactions. While Geographic Information Systems are effective for spatial tasks, these abstractions often fail to understand notions of place when compared to space.
PlaceCrafter responds to this challenge by integrating a spatial-platial approach to identifying regions that are functionally cohesive—representing dense and meaningful concentrations of specific Points of Interest (POIs).
From Space to Place
Traditional GIS works with spatial representations: cafés, museums, and places of worship appear as points, lines, or polygons on a map. But these abstractions miss something crucial—how space is actually used by communities.
Rather than relying on top-down administrative boundaries, PlaceCrafter enables researchers to curate clusters that represent functional use of urban space. The tool aligns with recent calls in GIScience to shift from “space” to “place” in smart city analysis, building on work that has operationalised sense of place in urban contexts.
How PlaceCrafter Works
The framework is structured around four core phases:
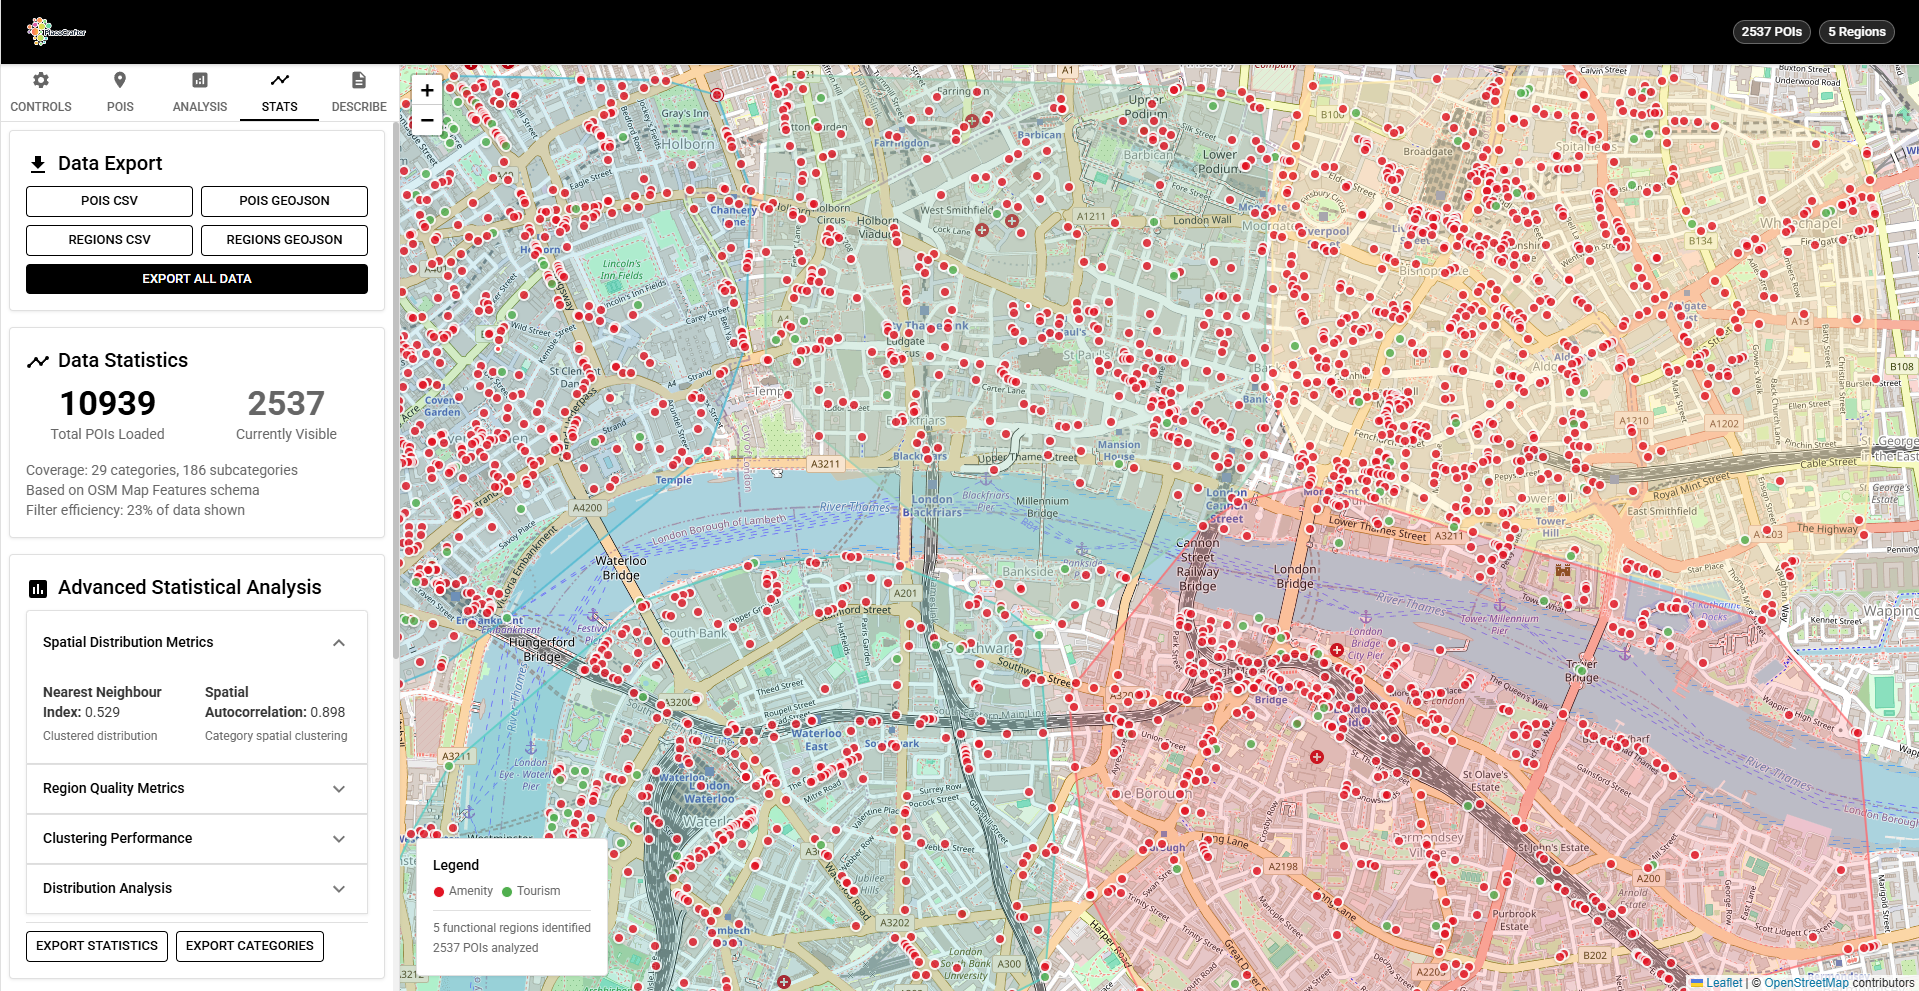
1. Filtering and Selection
PlaceCrafter uses the Overpass API to retrieve near real-time POI data from OpenStreetMap. Datasets are organised into categories based on existing OSM semantic structures, which can be customised depending on the analytical task. This enables researchers to focus on specific themes—tourism, leisure, commerce, or cultural heritage.
2. Interactive Clustering
The platform offers multiple clustering algorithms, each suited to different analytical questions:
- K-Means for compact, well-defined formations
- DBSCAN for identifying spatial structures without pre-specifying cluster counts
- Hierarchical clustering for multi-level analysis
These methods are applied interactively to grouped and filtered POI data, revealing dynamic regions that emerge from the spatial distribution of places.
3. Statistical Validation
Each clustered region is evaluated using established spatial metrics:
- Nearest Neighbour Index to assess spatial clustering strength
- Silhouette scores for understanding cluster coherence
- Moran’s I statistic for insights into category-based spatial dependency
This rigorous validation ensures that identified regions represent genuine functional structures rather than arbitrary groupings.
4. Platial Visualisation
The visualisation subsystem supports multiple approaches for conveying ambiguity, overlap, and functional gradients:
- Fuzzy spray-can visualisation
- Region influence grids
- Convex hulls
- Kernel density heatmaps
- Region quality indicators
Each region is presented not just spatially but semantically, with data on POI type, diversity score, and density metrics.
Case Study: Nottingham, UK
A case study using PlaceCrafter analysed Nottingham and surrounding areas, focusing on tourism, historical, leisure, and natural categories:
| Metric | Value |
|---|---|
| Total POIs | 534 |
| Functional Regions | 18 (K-Means) |
| Historical POIs | 344 |
| Leisure POIs | 111 |
| Moran’s I | 0.68 (strong autocorrelation) |
| Silhouette Score | 0.83 (high cohesion) |
The spatial pattern reflects Nottingham’s diverse landscape, with dense clusters in the city centre around historical POIs, while suburban and rural areas show more diffuse patterns of historic and leisure clustering.
Technical Implementation
PlaceCrafter is built as a modern web application using:
- TypeScript and React for the frontend framework
- Vite for fast development builds
- Leaflet for interactive mapping
- Turf.js for spatial analysis operations
- D3.js for data visualisation
All POI data is sourced from OpenStreetMap via the Overpass API under the Open Database License.
Limitations and Future Work
PlaceCrafter captures place through functional coherence of POIs, but it doesn’t yet capture temporal or subjective meanings that also shape lived experiences. The crowd-sourced nature of OpenStreetMap means that places tied to commerce or tourism are more visible than informal or everyday categories.
Planned expansions include:
- Historical analysis to track the evolution of platial regions over time
- Multi-comparative views enabling cities, timeframes, and thematic domains to be compared
- Qualitative user studies investigating how analysts interpret and engage with PlaceCrafter’s outputs
Open Source
PlaceCrafter is available as open-source software, enabling broader use, adaptation, and academic contributions in platial information systems.
Explore the tool: github.com/jwilliamsresearch/PlaceCrafter
This work was presented at OSMScience 2025 in Manila, Philippines. The paper was co-authored with Gary Priestnall from the University of Nottingham.